In the fast-paced world of trade indices, mastering technical analysis is akin to wielding a potent weapon. This article navigates the intricate realm of technical analysis, unveiling crucial indicators that savvy traders should keep a watchful eye on.
Harnessing Technical Analysis
When it comes to navigating the tumultuous waters of trade indices, a comprehensive understanding of technical analysis is paramount. Technical analysis involves scrutinising historical price and volume data to predict future market movements. By identifying trends, patterns, and key indicators, traders can make more informed decisions, potentially capitalising on market fluctuations and seizing opportunities.
Also Read N: Why Your Next Washing Machine Should Be a Top Loader
1. The Art of Reading Price Charts
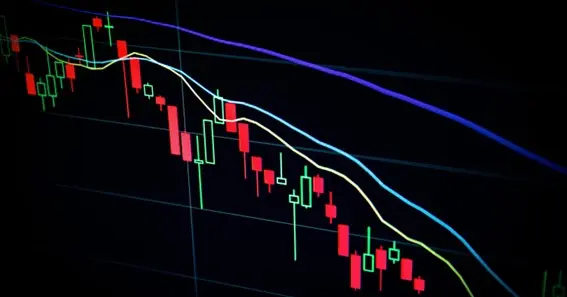
At the core of technical analysis lies the art of interpreting price charts. Traders utilise line charts, bar charts, and candlestick charts as instruments to visually represent the historical price fluctuations of indices. By analysing these charts, traders can spot trends ranging from upward momentum (bullish) to downward shifts (bearish), which play a pivotal role in decision-making.
Also Read P: Essential Safety Tips to Consider When Using Lifting Slings
2. Moving Averages: Smoothed Insights
Moving averages are indispensable indicators for its analysis. These lines smooth out price fluctuations, revealing the overarching trend. Traders often focus on two types: the simple moving average (SMA) and the exponential moving average (EMA). The SMA considers a fixed number of data points, while the EMA prioritises recent prices. By comparing these moving averages to the current price, traders can gauge potential reversals or confirm trends.
3. Relative Strength Index (RSI):
The RSI is a powerful momentum indicator in market trackers. It fluctuates within a range of 0 to 100, signifying whether an index is in an overbought state (above 70) or oversold condition (below 30). This information assists traders in predicting potential reversals or continuations of trends. By observing the RSI’s movement, traders can adjust their strategies accordingly.
4. Moving Average Convergence Divergence (MACD):
The MACD is a versatile indicator that encompasses both trend-following and momentum principles. Comprising a MACD line and a signal line, it can signal potential buy or sell opportunities. When the MACD line crosses above the signal line, it may signify a bullish trend, while a cross below could indicate a bearish trend. This indicator’s ability to capture shifts in both momentum and trend makes it a trader’s invaluable ally.
5. Fibonacci Retracements: Unveiling Support and Resistance
Fibonacci retracements are rooted in the golden ratio, a mathematical concept. By plotting retracement levels on a chart, traders can identify potential support and resistance zones. These levels often coincide with significant price movements, guiding traders in making strategic decisions about entry and exit points.
6. Trading Volume: The Unspoken Clue
Volume is a silent storyteller in market trackers. It reveals the intensity of market activity, signalling whether a trend is genuine or fading. Elevated trading volume amid price surges indicates robust buying enthusiasm, whereas heightened volume during price declines could signify significant selling pressure. Observing volume trends can enhance traders’ understanding of market sentiment.
Conclusion: Unveiling Opportunities Through Technical Mastery
Mastering technical analysis for trading indices is a journey of continuous learning and adaptation. By embracing indicators like moving averages, RSI, MACD, Fibonacci retracements, and volume, traders equip themselves with tools to decode the market’s language. In a realm where information is power, these indicators become the beacon guiding traders through the intricate dance of price movements.
As traders immerse themselves in the world of technical analysis, they unlock the potential to anticipate market shifts, seize opportunities, and make calculated decisions. The art of reading charts and understanding indicators becomes the compass that guides them through the labyrinth of trade indices, translating data into actionable insights. With every trend identified and every pattern recognized, traders’ inch closer to mastering the intricate world of trade indices and reaping the rewards it offers.